Data-driven is a word that we always hear while talking about product development or business decision-making.
Let’s focus on software development, what are the basic metrics we should focus on? This question may be a bit challenging for anyone working in a product team. In this post, I’ll try to answer that question by covering the foundation of Product Metrics for typical Software-as-a-Service (SaaS) platforms.
SaaS common metrics
Committed Monthly Recurring Revenue (CMRR)
This metric is straightforward but extremely important to evaluate how the company is making money. Continuous growth is a good sign for investors to invest more money even though the company is not profitable yet.
Cost Per Acquisition (CPA)
This represents how much it costs to acquire a new customer. The lower the CPA, the better. We have lower-level metrics to evaluate this like:
- Advertising cost per thousand (CPM): the cash investment for advertising on average (via all platforms) to acquire 1000 subscribers
- Visits to lead: number of visits required to transform a visitor into an engaged client
- Visits to subscriptions: number of visits required to transform an engaged client to an official subscriber
Life Time Value (LTV)
The amount of money each customer could bring to the company in the whole user’s lifetime. Logically, a healthy and profitable business model requires CPA to be less than LTV.
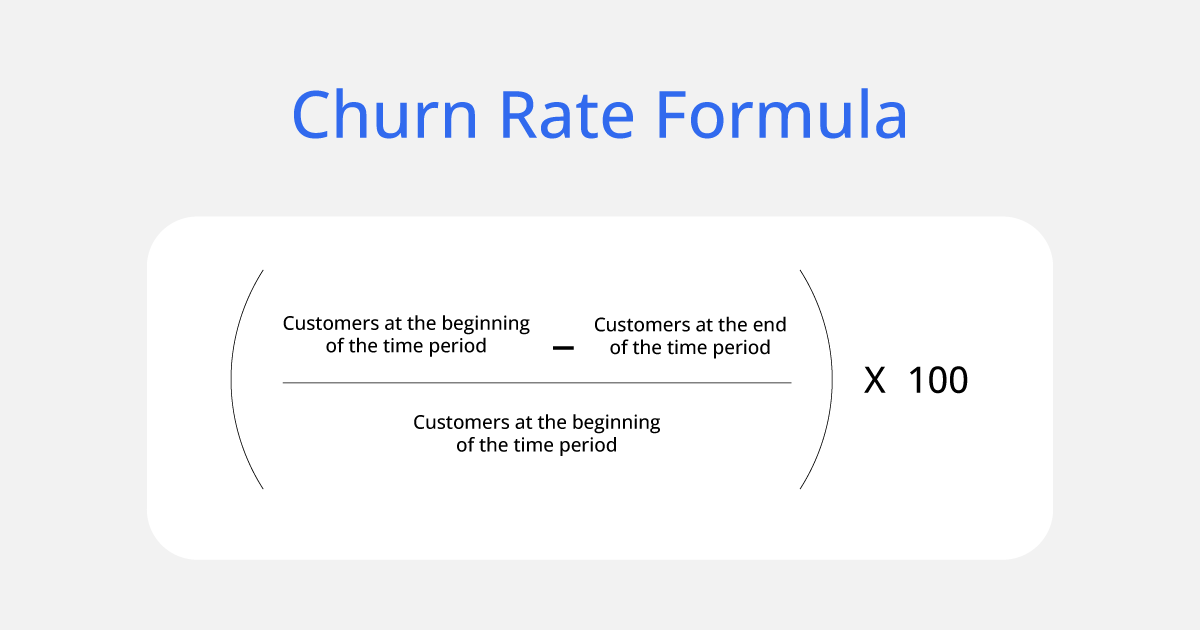
Churn Rate
The percentage of customers who are leaving the product / cancel the subscriptions (typically in a month).
Notice that the Churn Rate can still be high although revenue and number of users are increasing. It’s possible as long as the number of new users is greater than the number of left users. We can accomplish this by spending massive advertising, and promotion campaigns which are noted as operation cost/investment.
Relationship between CMRR, CPA, LTV, and Churn Rate
Continuously growing revenue is not always a good sign of running a good business. This is one of the biggest illusions of business scaling. Revenue is not everything yet to ensure sustainable business growth. We also need to keep CPA and Churn Rate as low as possible, and LTV as high as possible. The balance point is up to the industry nature, competitor pressure at a certain point, and the business model itself.
Net Promoter Score (NPS)
This is the core metric to measure the overall customer perception of the product which can help predict growth opportunities.
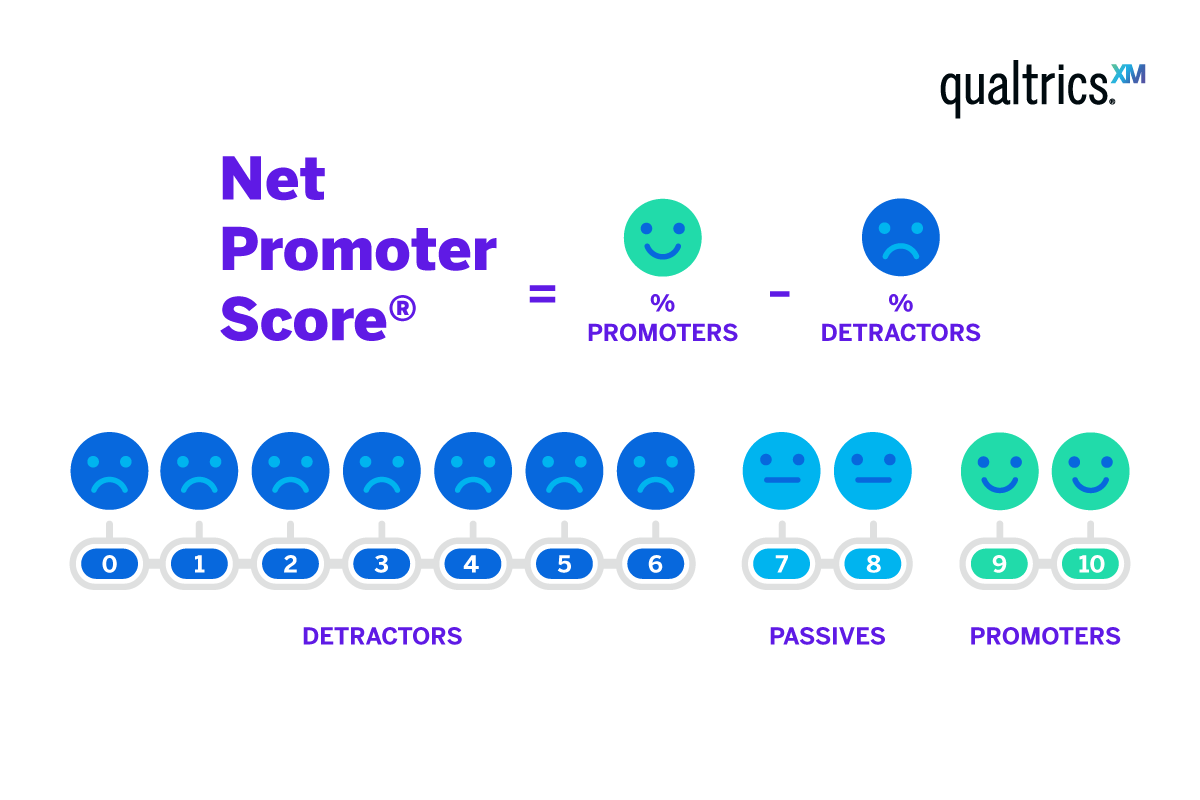
Nowadays, it’s a very popular tool being applied by most of the product teams to identify users’ critical pain points in using the products as well as identify the added values that users value the most.
North Star Metric
This metric visualizes how the product is reaching its vision and goals. Usually, the actions measured for this metric are the key flow of the product. The more users go through this flow, the more successful the product is in terms of solving user problems, and increasing user lives.
These are some examples:
- Mobile Commerce Business: number of mobile orders delivered
- Facebook in early days: number of users adding 7 friends in the first 10 days
- Grown hack in SAAS companies: trial accounts with more than 3 users active in week 1
Conclusion
Having metrics is fancy but reading them is difficult. We all should be very careful in extracting the meanings behind any charts, or diagrams because the whole meaning can be changed by having other contexts.
Leave a Reply
You must be logged in to post a comment.